Every charting platform ships the same handful of indicators with the same default settings: RSI at 14 with lines at 30 and 70, MACD at 12, 26 and 9, Bollinger Bands at 20 and 2. Millions of traders start there, and a lot of trading bots never leave. We wanted to know what those defaults would actually have done on crypto, after the fees a normal account pays, compared with the simplest alternative: buying the coin and holding it.
So we tested 11 classic strategies exactly as the textbooks describe them, on 7 large coins, on daily and 4-hour candles, from January 2020 to October 2026. Nothing was tuned. That gave 154 strategy runs, each compared with buying and holding the same coin over the same period.
Short version: most of the strategies made money, and most of them still lost to buy and hold. They did their job in the 2022 crash and gave far more back in the rising years. The mean-reversion rules never beat holding once.
Key findings
- Of 154 backtests of 11 classic indicator strategies at default settings on 7 cryptocurrencies (January 2020 to October 2026), 32 (21%) beat buy and hold on net return after fees and slippage.
- On risk-adjusted terms (annual return divided by the worst drawdown), 51 of 154 default-setting indicator strategy runs (33%) beat buying and holding the same coin.
- The three mean-reversion strategies at default settings (RSI 30/70, Bollinger Band reversion and Stochastic 20/80) beat buy and hold in 0 of 42 crypto backtests and lost money in 26.
- On Bitcoin, 1 of 22 default-setting indicator backtests beat buy and hold from 2020 to October 2026: the daily EMA 9/21 cross, at +1,308.7% against +976.0%.
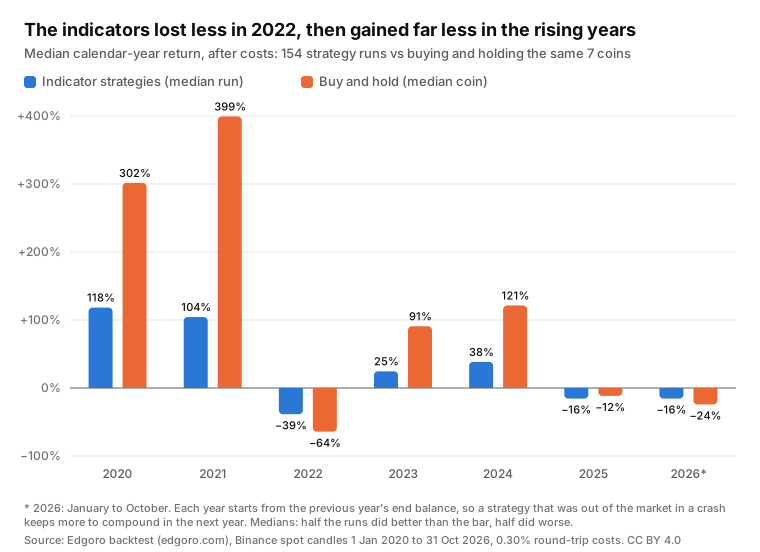
- In the 2022 crypto bear market, 150 of 154 indicator strategy runs lost less than buy and hold (median −38.5% against −64.2%), but in 2021 only 19 of 154 kept up (median +104.3% against +399.3%).
- On 4-hour crypto candles, trading costs of 0.30% per round trip cut the indicator strategies that beat buy and hold from 26 to 13 of 77, with a median of 240 trades per run.
- Default-setting indicator strategies were in the market a median 44.2% of the time, yet their median worst drawdown was still −75.1%, against −83.9% for buy and hold.
How we tested
| Markets | Binance spot, USDT pairs: BTC, ETH, BNB, XRP, ADA, DOGE and LINK. SOL is reported separately because its history starts in August 2020 |
| Data | Monthly candle files from Binance's public data site (data.binance.vision), 1,454 files, every one checked against Binance's SHA-256 checksum |
| Test period | 1 January 2020 to 31 October 2026: 2,496 daily and 14,975 four-hour candles per coin. Data from 2019 only warms the indicators up |
| Timeframes | Daily and 4-hour candles (UTC) |
| Execution | Signal on the candle's close, order filled at the next candle's open. No look-ahead |
| Position | The whole account in or out. Long only, no leverage, no stop-loss other than the strategy's own exit |
| Costs | 0.10% fee + 0.05% slippage per side, so 0.30% per round trip |
| Cash | Earns nothing while out of the market |
| Benchmark | Buy and hold: buy at the first open, sell at the last close, same costs |
| Runs | 7 coins × 2 timeframes × 11 strategies = 154 strategy runs, plus 14 buy-and-hold runs |
The strategies, each at its textbook setting. "Above" means on the candle's close; the trade happens at the next open.
| Strategy | Buy when | Sell when |
|---|---|---|
| RSI(14) 30/70 | RSI crosses back above 30 | RSI crosses above 70 |
| MACD(12,26,9) signal cross | MACD line above its signal line | MACD line below its signal line |
| EMA 9/21 cross | EMA(9) above EMA(21) | EMA(9) below EMA(21) |
| SMA 50/200 golden cross | SMA(50) above SMA(200) | SMA(50) below SMA(200), the death cross |
| Bollinger(20,2) reversion | Close below the lower band | Close above the middle band (the 20-period average) |
| Bollinger(20,2) breakout | Close above the upper band | Close below the middle band |
| Supertrend(10,3) | Supertrend direction turns up | Supertrend flips down |
| Donchian 20/10 breakout | Close above the highest high of the previous 20 candles | Close below the lowest low of the previous 10 candles |
| Stochastic(14,3,3) 20/80 | Slow %K crosses back above 20 | Slow %K crosses above 80 |
| ADX(14) > 25 with DI cross | +DI above −DI and ADX above 25 | +DI below −DI |
| Ichimoku Tenkan/Kijun cross | Tenkan-sen (9) above Kijun-sen (26) | Tenkan-sen below Kijun-sen |
The indicator formulas are TradingView's (Wilder's smoothing for RSI, ATR and ADX). The simulation uses the same execution model and the same accounting as Edgoro's Backtest Lab engine. Eight of the eleven strategies can be written in the lab's own rule format, so we also ran those 128 runs through the engine itself: every one matched to the cent. As a second check, an independent Python version of three runs (EMA 9/21 and SMA 50/200 on BTC daily, SMA 50/200 on ETH 4-hour) gave the same returns, trade counts and drawdowns.
We measured net return, annual return (CAGR), worst drawdown, profit factor, number of trades, time in the market, and annual return divided by worst drawdown, a simple risk-adjusted score. One candle is missing from Binance's 4-hour files for every coin (19 February 2020, 08:00 to 16:00 UTC); there are no gaps in the daily files.
The headline result
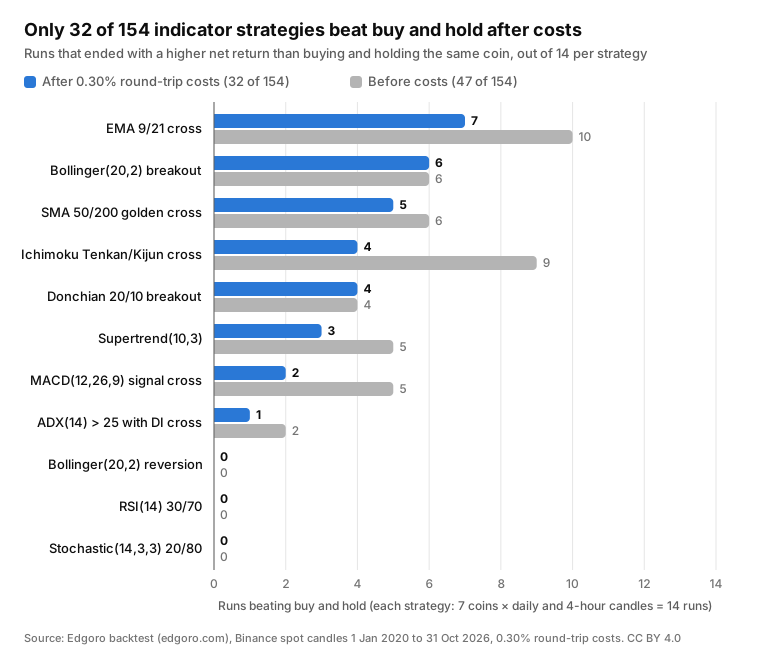
32 of the 154 runs finished with a higher net return than buying and holding the same coin. Before costs, 47 would have. At the same time, 123 of the 154 made money. Most of these strategies were profitable and still worse than doing nothing clever at all, which is why a backtest that only reports profit tells you very little.
| Strategy | Beat buy and hold (of 14) | Before costs | Beat it on return ÷ drawdown | Made money (of 14) | Median net return | Median worst drawdown | Median trades, daily / 4h | Median time in market |
|---|---|---|---|---|---|---|---|---|
| EMA 9/21 cross | 7 | 10 | 7 | 14 | +1,092.3% | −78.4% | 53 / 338 | 51.1% |
| Bollinger(20,2) breakout | 6 | 6 | 9 | 13 | +757.8% | −64.3% | 46 / 275 | 30.0% |
| SMA 50/200 golden cross | 5 | 6 | 7 | 13 | +1,023.2% | −76.6% | 8 / 45 | 51.9% |
| Ichimoku Tenkan/Kijun cross | 4 | 9 | 7 | 14 | +696.6% | −70.7% | 58 / 362 | 52.9% |
| Donchian 20/10 breakout | 4 | 4 | 8 | 13 | +906.6% | −74.6% | 34 / 206 | 41.0% |
| Supertrend(10,3) | 3 | 5 | 5 | 14 | +638.0% | −81.1% | 28 / 170 | 50.7% |
| MACD(12,26,9) signal cross | 2 | 5 | 5 | 12 | +433.9% | −82.9% | 86 / 586 | 51.2% |
| ADX(14) > 25 with DI cross | 1 | 2 | 3 | 14 | +269.5% | −66.9% | 40 / 217 | 26.7% |
| RSI(14) 30/70 | 0 | 0 | 0 | 7 | +18.2% | −75.8% | 10 / 59 | 44.4% |
| Stochastic(14,3,3) 20/80 | 0 | 0 | 0 | 4 | −18.0% | −79.5% | 37 / 240 | 37.3% |
| Bollinger(20,2) reversion | 0 | 0 | 0 | 5 | −52.7% | −76.9% | 39 / 267 | 26.6% |
| Buy and hold (median coin) | 14 | +976.0% | −83.9% | 1 | 100% |
Two families split cleanly. The eight trend and breakout rules made money in 107 of their 112 runs and produced all 32 of the wins. The three mean-reversion rules made money in 16 of 42 runs and never beat holding. Buying after a fall and selling into the first strength is a reasonable idea in a market that goes sideways. Crypto from 2020 to 2026 mostly didn't: it trended hard in both directions, so these rules tended to sell early in rallies and buy early in declines.
Buy and hold was a high bar
| Coin | Buy and hold, net return | Per year | Worst drawdown (daily) | 2022 | Runs that beat it on return (of 22) | On return ÷ drawdown (of 22) |
|---|---|---|---|---|---|---|
| BTC | +976.0% | +41.5% | −76.6% | −64.2% | 1 | 7 |
| ETH | +1,642.8% | +51.9% | −79.3% | −67.5% | 4 | 7 |
| BNB | +5,022.0% | +77.8% | −70.9% | −51.8% | 1 | 7 |
| XRP | +547.8% | +31.4% | −83.2% | −59.2% | 6 | 7 |
| ADA | +486.2% | +29.5% | −95.2% | −81.2% | 10 | 10 |
| DOGE | +3,648.4% | +69.9% | −92.3% | −58.7% | 10 | 12 |
| LINK | +558.7% | +31.7% | −90.2% | −71.4% | 0 | 1 |
All seven coins rose at least fivefold over the period, so a strategy that is out of the market about half the time has to dodge a lot of losses to make up for the gains it misses. 20 of the 32 wins came from just two coins, ADA and DOGE, and both had a worst drawdown above 90% for a holder: where holding hurt most, stepping aside paid most often. It isn't a rule, though. LINK also fell 90% from its peak, and no strategy beat holding it. On BNB and BTC, one run each did.
Bitcoin, strategy by strategy
Daily candles, 1 January 2020 to 31 October 2026, after costs, sorted by net return.
| Strategy | Net return | Per year | Worst drawdown | Return ÷ drawdown | Profit factor | Trades | Time in market |
|---|---|---|---|---|---|---|---|
| EMA 9/21 cross | +1,308.7% | +47.2% | −61.4% | 0.77 | 1.89 | 49 | 54% |
| Buy and hold | +976.0% | +41.5% | −76.6% | 0.54 | n/a | 1 | 100% |
| Donchian 20/10 breakout | +806.5% | +38.0% | −54.3% | 0.70 | 1.67 | 35 | 51% |
| Ichimoku Tenkan/Kijun cross | +770.8% | +37.2% | −57.3% | 0.65 | 1.45 | 53 | 56% |
| ADX(14) > 25 with DI cross | +692.7% | +35.4% | −35.6% | 0.99 | 2.40 | 39 | 32% |
| MACD(12,26,9) signal cross | +661.7% | +34.6% | −54.4% | 0.64 | 1.42 | 90 | 51% |
| Supertrend(10,3) | +442.7% | +28.1% | −53.9% | 0.52 | 1.56 | 30 | 53% |
| SMA 50/200 golden cross | +316.9% | +23.2% | −57.0% | 0.41 | 3.14 | 8 | 58% |
| Bollinger(20,2) breakout | +122.9% | +12.4% | −63.1% | 0.20 | 1.20 | 58 | 33% |
| RSI(14) 30/70 | +70.4% | +8.1% | −50.4% | 0.16 | 2.01 | 10 | 37% |
| Bollinger(20,2) reversion | −16.6% | −2.6% | −53.0% | −0.05 | 0.89 | 39 | 22% |
| Stochastic(14,3,3) 20/80 | −16.7% | −2.6% | −61.2% | −0.04 | 0.90 | 43 | 30% |
Only the EMA 9/21 cross beat holding on return. Five strategies beat it on return ÷ drawdown, and the ADX rule stands out: it was in the market 32% of the time and its worst drawdown was −35.6%, less than half of buy and hold's. Note the golden cross: a profit factor of 3.14 and only 8 trades in almost seven years, and still a third of buy and hold's return. A high profit factor says the winners were big compared with the losers; it says nothing about what you missed while out of the market.
Year by year: protection in 2022, a heavy price in the good years
| Year | Median strategy run | Median buy and hold | Runs that beat buy and hold that year |
|---|---|---|---|
| 2020 | +118.2% | +301.7% | 32 of 154 |
| 2021 | +104.3% | +399.3% | 19 of 154 |
| 2022 | −38.5% | −64.2% | 150 of 154 |
| 2023 | +24.5% | +90.8% | 7 of 154 |
| 2024 | +38.4% | +121.3% | 24 of 154 |
| 2025 | −15.6% | −11.6% | 83 of 154 |
| 2026, January to October | −15.5% | −24.2% | 106 of 154 |
This is the trade-off in one table. In 2022, almost every strategy lost less than holding, because almost every rule was out of the market for much of the decline. In the years when crypto rose, the rules were late in and early out: the median run made between 26% and 39% of what the median holder made. 2025 was mixed: holding lost 11.6% for the median coin, the median run lost 15.6%, and only about half the runs (83 of 154) did better than holding their coin. In a choppy market, trend rules tend to buy moves that fade, and pay costs on each one.
What costs did
On daily candles the median run made 40 trades over the whole period, and costs took 11.2% of what it would have ended with at zero cost. On 4-hour candles the median run made 240 trades, and costs took 51.3%. That is why costs barely changed the daily results (21 runs beat buy and hold before costs, 19 after) but halved the 4-hour ones (26 before, 13 after).
The extreme case is MACD on Bitcoin's 4-hour chart: 571 trades, +244.1% before costs, −38.0% after. The arithmetic is simple: each round trip keeps 99.7% of the position, and 0.997 multiplied by itself 571 times is about 0.18. The strategy had to more than quintuple the account just to pay for its own trading.
Ichimoku shows the same thing on a whole strategy: 9 of its 14 runs beat buy and hold before costs, 4 after. If you take one number from this section, take the median trade count of whatever you're testing and work out (1 − round-trip cost) to that power before you look at anything else. Our trading fee calculator does the arithmetic.
Smaller drawdowns, but not small
The case for these rules is usually risk, not return, and that part holds up better: 135 of the 154 runs had a smaller worst drawdown than buy and hold, and 51 of 154 beat it on return ÷ drawdown (34 of 77 on daily candles, 17 of 77 on 4-hour). Every one of the 32 runs that beat holding on return also had a smaller worst drawdown.
But the drawdowns were still huge. The median run lost 75.1% from its peak at some point, against 83.9% for holding. A rule that steps aside during long declines doesn't protect you from fast crashes, or from a market that chops back and forth across the signal: we saw the same thing with the 200-day moving average filter. If a 75% drawdown would make you abandon the strategy, the position is too big, whatever indicator runs it.
SOL, tested separately
SOL/USDT has only traded on Binance since August 2020, so it couldn't join the main sample. We ran the same 11 strategies on it from 1 March 2021 (once the 200-day average existed) to 31 October 2026. Buy and hold made +628.9% with a worst drawdown of −96.3%, and 11 of the 22 runs beat it: 8 of 11 on daily candles, 3 of 11 on 4-hour. The best was Supertrend on daily candles, +5,091.2% with a −56.9% worst drawdown. The mean-reversion rules beat holding in 0 of 6 runs again. SOL is the deepest-drawdown coin in the test, and the pattern matches ADA and DOGE: trend rules helped most where holding hurt most.
What this study doesn't show
- Only default settings. We tested what most people start with, on purpose. Other settings give other results, and choosing the best one after seeing the results would overstate what you could have earned. Our guide to walk-forward and out-of-sample testing explains why.
- One period, two regimes. The test covers two big bull markets, one deep bear market and a choppy 2025. Buy and hold is hard to beat when every coin rose at least fivefold. A long flat or falling market would favour the strategies.
- The coin list is a survivor list. These coins were picked in 2026 because they are still large. Many coins that looked like them in 2020 lost almost everything; holding those would have looked far worse, and trend rules would have looked better.
- Nothing was tuned, so there is no out-of-sample test. That avoids fitting the past, but it also means this is one historical path, not evidence that any rule will keep working.
- Seven coins are not seven independent tests. They tend to rise and fall together.
- Simplifications. Long only, all-in, no stop-loss beyond each rule's exit, no taxes, and cash earns nothing (a stablecoin yield would help the strategies a little, since they are out of the market more than half the time). 0.05% slippage is reasonable for these pairs at retail size and too low for large orders.
- Past results don't predict future results. This is a description of what happened, not a forecast.
What to take from it
- Compare with buy and hold, not with zero. 123 of 154 runs made money; 32 beat holding. A backtest without a benchmark can make a weak strategy look good.
- Don't run long-only oscillator mean reversion on a trending asset at default settings. RSI 30/70, Stochastic 20/80 and Bollinger reversion went 0 for 42.
- Count your trades before you trust a result. On 4-hour candles, costs took about half the ending balance of the median run. A lower timeframe needs a bigger edge per trade to survive.
- If you use an indicator for protection, judge it on drawdown, and expect to pay for it in bull years. The trend rules lost less in 2022 and kept between a quarter and a third of holding's gains in 2021, 2023 and 2024.
- Treat the best result as luck until it holds up elsewhere. The single best run, ADX on DOGE's 4-hour chart, made +14,186.9%; the same rule on BTC's 4-hour chart made +137.5%. A rule that only shines on one coin and one timeframe probably found that coin's history, not an edge.
Download the data
The full results are in a CSV file: default-indicator-strategies-crypto-backtest.csv. It has 192 rows: the 154 strategy runs and 14 buy-and-hold runs of the main sample, plus 24 SOL rows marked "supplement". Each row has the strategy's rules, net return, CAGR, worst drawdown, return ÷ drawdown, profit factor, trades, win rate, time in the market, Sharpe ratio, fees paid, the zero-cost return, the same coin's buy-and-hold figures, whether the run beat buy and hold, and the return of each calendar year from 2020 to 2026.
The data is free to reuse under the Creative Commons Attribution 4.0 licence. Please credit "Edgoro" and link to this page. Suggested citation: Edgoro (2026), "We backtested 11 classic indicators at their default settings on crypto", edgoro.com/blog/default-indicator-settings-crypto-backtest.
Sources
- Binance public data: monthly spot candle files with SHA-256 checksums.
- Binance trading fees: 0.100% maker and taker for regular spot accounts.
- TradingView Pine Script reference: the formulas of ta.rsi, ta.macd, ta.supertrend, ta.dmi and the other built-ins we matched.
Test your own version
The defaults are a starting point, not a strategy. If you want to try a variation (a different length, a trend filter, a stop, another coin), describe it in plain English to the crypto bot builder or the Pine Script generator, then run it through the Backtest Lab, which charges fees and slippage by default, holds back an out-of-sample period and shows buy and hold next to every result. Before you trust any number, go through our list of backtesting mistakes that inflate results.
This article describes historical simulations for educational purposes. It isn't investment advice, and past results, simulated or real, don't predict future returns. Crypto prices can fall a long way quickly, with or without an indicator. If you trade, test on a demo account first and only risk money you can afford to lose.
Frequently asked questions
Do default indicator settings beat buy and hold on crypto?
Rarely, in our test. Across 11 strategies, 7 coins and daily and 4-hour candles from January 2020 to October 2026, 32 of 154 runs ended with a higher net return than buying and holding the same coin, after 0.10% fees and 0.05% slippage per side. 123 of the 154 made money, so most were profitable and still trailed holding.
Which default indicator strategy did best in the backtest?
The EMA 9/21 cross beat buy and hold in 7 of its 14 runs, more than any other strategy, including the only Bitcoin run that did: +1,308.7% against +976.0% on daily candles. On risk-adjusted terms, ADX(14) above 25 with a DI cross did best on Bitcoin's daily chart, with a −35.6% worst drawdown against −76.6% for holding.
Why did RSI and Stochastic lose on crypto?
Long-only mean reversion buys after a fall and sells into the first strength. From 2020 to 2026 crypto trended hard in both directions, so these rules sold early in rallies and bought early in declines. RSI(14) 30/70, Bollinger(20,2) reversion and Stochastic(14,3,3) 20/80 beat buy and hold in 0 of 42 runs and lost money in 26.
What fees and slippage did the backtest assume?
0.10% per side, Binance's regular spot fee, plus 0.05% slippage per side: 0.30% per round trip. Signals were taken on the candle's close and filled at the next candle's open.
Can I reuse the data from this study?
Yes. Every run is in a CSV file at edgoro.com/data/default-indicator-strategies-crypto-backtest.csv under the Creative Commons Attribution 4.0 licence: reuse it freely, credit Edgoro and link to the study.
Want our studies and guides first when you search? Add Edgoro as a preferred source on Google.